
picture alliance / CFOTO | CFOTO
Tracker
Economic Indicators
Navigating the path to recovery and growth
MERICS Economic Indicators Q1/2023
Q1 analysis: Mixed picture: Economic rebound is gradually taking shape as policies are fine-tuned
Hopes that China’s economy would roar back into life once it was freed from the zero-Covid lockdowns that suppressed GDP growth last year have been sobered by reality despite improvements in economic data in Q1 2023. The pandemic has continued to disrupt the economy as Covid outbreaks hurt industrial and consumer activity in January and February. But growth is likely to pick up over the coming months as normalization sets in.
GDP expanded by 4.5 percent in Q1, up from 2.9 percent in the final quarter of 2022. In the next few months, China’s economic data will get a boost from base effects alone, as strict lockdowns in Shanghai and other cities in the second quarter of 2022 squeezed growth to only 0.4 percent. How strong, and sustainable, the eventual post-Covid bounce will be remains to be seen. However, a sense of optimism has returned as the country opens up.
For now, the government is keeping the lid on stimulus measures in favor of a more controlled - and slower – recovery. This is reflected in the modest GDP growth target of “around 5 percent” – a safe and unambitious target given that annual growth in 2022 hit a nearly 50-year low of 3 percent. However, it represents a missed opportunity for the government to finally drop the annual official growth target altogether.
New premier Li Qiang has his work cut out to boost confidence in the economy. Li has launched a charm offensive to woo domestic entrepreneurs and global CEOs about the prospects of the Chinese economy. Regulatory crackdowns in the tech and real estate sectors that subdued overall growth and investor confidence are leveling off. The leadership is doubling down on national strategic priorities geared to strengthen China’s prowess in manufacturing and innovation. However, this will not in itself generate enough growth or jobs.
Revitalizing the economy remains an uphill battle. The leadership remains vigilant about risks in the financial system, so will limit stimulus measures. Meanwhile, slower export growth will also likely constrain GDP growth despite the uptick in March.
A key factor for the strength of the recovery in the coming quarters will be the rebound in consumption and services. These sectors are crucial for GDP growth and job creation, at a time when youth unemployment remains persistently high. Faced with another record cohort of 11.6 million university graduates ready to enter the labor market this year, China’s leadership will put employment growth front and center of its thinking. Looking forward, the scope and pace of support programs for job creation and training will be a good indicator to assess the leadership’s confidence in the recovery. Managing a growing skills mismatch and diverging expectations of new job entrants poses a structural challenge to the government’s economic policies.
![]() Hover over/tap the chart to see more details.
Hover over/tap the chart to see more details.
Exhibit 1
The MERICS China Confidence Index (MCCI)
The MERICS China Confidence Index measures household and business confidence in future income and revenues. The index is weighted between household and business indicators. It includes the following indicators: stock market turnover, future income confidence, international air travel, new manufacturing orders, new business in the service sector, urban households’ house purchase plans, venture capital investments, private fixed asset investments and disposable income as a share of household consumption. All components have been tested for trends and seasonality.
The MCCI was first developed in Q1 2017.
Macroeconomics: Service sector improvement leads the way in Q1 recovery
Exhibit 2
![]() Hover over/tap the charts to see more details.
Hover over/tap the charts to see more details.
Exhibit 3
- GDP growth recovered to 4.5 percent in real terms in Q1 2023, the first quarter free of “zero-Covid” restrictions. Covid outbreaks left their mark in the first two months, before the situation improved in March. But China’s economy is finally leaving the pandemic induced unpredictability behind.
- Consumption is now the backbone of economic recovery, contributing over 66 percent to GDP growth in Q1. Its importance is likely to increase over the next quarter, as services were particularly weak in the Q2 2022 reference period, when the sector contracted by 0.4 percent.
- Finally freed of pandemic related restrictions, the service sector returned to being the economy’s biggest growth driver. For the first time in five quarters, service sector growth outpaced that of secondary industry which includes manufacturing and construction (see exhibit 1).
- China’s battered travel and tourism industry benefited most from the newly-won liberties. Growth in the accommodation and service sector jumped to 13.6 percent in Q1 year on year, after contracting by 5.8 percent in Q4 2022.
- The IT sector continued to improve after growth fell to a record low of just 7.6 percent in Q2 2022 year on year. Growth has been steadily improving since then, reaching 11.2 percent in Q1.
What to watch: The recovery will continue to vary by sector as the process of growth normalization sets in.
Business: Industrial output gears up again after a lull in Q4 2022
Exhibit 4
![]() Hover over/tap the charts to see more details.
Hover over/tap the charts to see more details.
Exhibit 5
- Industrial value-added production grew by 3.9 percent year on year in March 2023, up from 1.3 percent in December. Manufacturing growth rebounded from 0.2 percent in December to jump to 4.2 percent in March. But the recovery remains uneven, as only 26 of 41 major industries recorded output growth.
- Foreign enterprises in China continued to underperform domestic ones in industrial production. March saw growth 1.4 percent up on March last year, but negative growth in January and February produced a 2.7 per-cent decline foreign firms’ output in Q1. By contrast, state-owned enterprises and private firms grew by 3.3 percent and 2.0 percent respectively in Q1.
- Production of construction materials has finally recovered after two years of mostly negative growth. Cement production grew by 10.4 percent in March and 4.1 percent in Q1, while pig iron output was up 7.6 per-cent in Q1, and steel was 5.8 percent higher. The rebound in construction materials came from government stimulus (including more investment in rail and highway infrastructure) coupled with base effects of a weak year-earlier period on the data.
- Production growth at high-tech enterprises was weak overall, with only a 0.9 percent increase in Q1 growth, though there were some bright spots such as solar cells (up 69.7 percent in March) and new-energy vehicles (up 33.3 percent that month) from strong export demand in those sectors.
- Covid-outbreaks in late December meant a sluggish start to 2023 in automotive production. However, though value-added production fell by 1 percent in January and February, it surged to rise by 13.5 percent in March (see exhibit 1). New energy vehicle production also dipped in January but continues to grow fast, though it is unlikely to achieve triple-digit growth due to comparison with strong growth in 2022.
- The National Bureau of Statistics’ Manufacturing Purchasing Managers’ Index (PMI) rose above 50 in January and finished at 51.9 in March, reflecting optimism among manufacturers (see exhibit 2). For the services sector, Caixin’s Services PMI rose to 57.8, its highest level in over two years.
What to watch: Steady investment in infrastructure and manufacturing will provide industrial output with a protective floor against the backdrop of weak export demand and a dip in the electronics cycle.
International trade and investment: Exports stay resilient as growth rebounds sharply in March
Exhibit 6
![]() Hover over/tap the charts to see more details.
Hover over/tap the charts to see more details.
Exhibit 7
- After five consecutive months in the red, export growth bounced back in March, expanding by 14.8 percent year on year in US dollar terms. The month’s strong growth avoided a contraction in exports across the first quarter, but Q1 growth was only 0.5 percent compared to 15.8 percent in Q1 2022.
- Exports prevented falling off a cliff in a complicated external environment affected by high inflation and sluggish growth in key markets as well as rising geopolitical tensions. But the strong improvement in March could be a one-off. New export orders, tracked by the Purchasing Managers’ Index, softened to 50.4 in March down from 52.4 in February (values above 50 indicate positive sentiment).
- Export growth in March owed much to strong demand from the ASEAN region, where demand for Chinese goods surged by 35.4 percent year on year. This compares to just 3.4 percent for the EU and a contraction of 7.9 percent in the US. ASEAN is now China’s biggest export destination by far (see exhibit 1). Exports to ASEAN countries exceeded sales to the EU, China’s second largest market, by 10.3 percent in Q1.
- Booming vehicle exports were another factor supporting overall growth. Exports of Tesla cars made in Shanghai played a role, but Chinese auto brands are also expanding their global presence. The EU is the sector’s most important market, accounting for over 20 percent of total vehicle exports from China (see exhibit 2).
- Import growth contracted by 7.1 percent in US dollar terms during Q1. Demand for commodities generally held up better than manufactured goods. For example, import volume of iron and copper ore increased by 9.8 percent and 5.1 percent respectively during the same period, signaling a rebound in construction. By contrast, vehicle imports contracted (-27.4 percent), as did machine tools (-9.8 percent).
What to watch: Growing demand for commodities is likely to drive import growth as real estate and infrastructure activity picks up.
Financial markets: More policy support to encourage recovery of credit growth
- Investor confidence has been recovering from historic lows since the scrapping of “zero-Covid” lockdowns. The central bank has supported increases in credit supply to boost investments. Concerns remain about financial risk but – for now - policy support for the still-fragile economic recovery takes priority over deleveraging – as is evident in signs of easing up on the hard-hit real estate sector.
- The People’s Bank of China (PBOC) adjusted monetary policy further over Q1 to add liquidity to the economy. The banking sector’s required reserve ratios (RRR) were lowered again, by another 0.25 points, in March, following the last cut in December. In 2022, the RRR was lowered three times. It has been reduced to 7.6 percent, down from 10.4 percent. The policy has led to substantial net liquidity injections, which reached 0.5 percent of GDP in Q1.
- The PBOC’s Bankers’ Survey Index indicates credit demand will gain pace. The index for manufacturing and infrastructure credit demand shot up to over 70 percent – the highest level since 2009. The sub-index for real estate jumped by over 10 points in Q4 2022, but it only reached 55.3 percent in Q1.
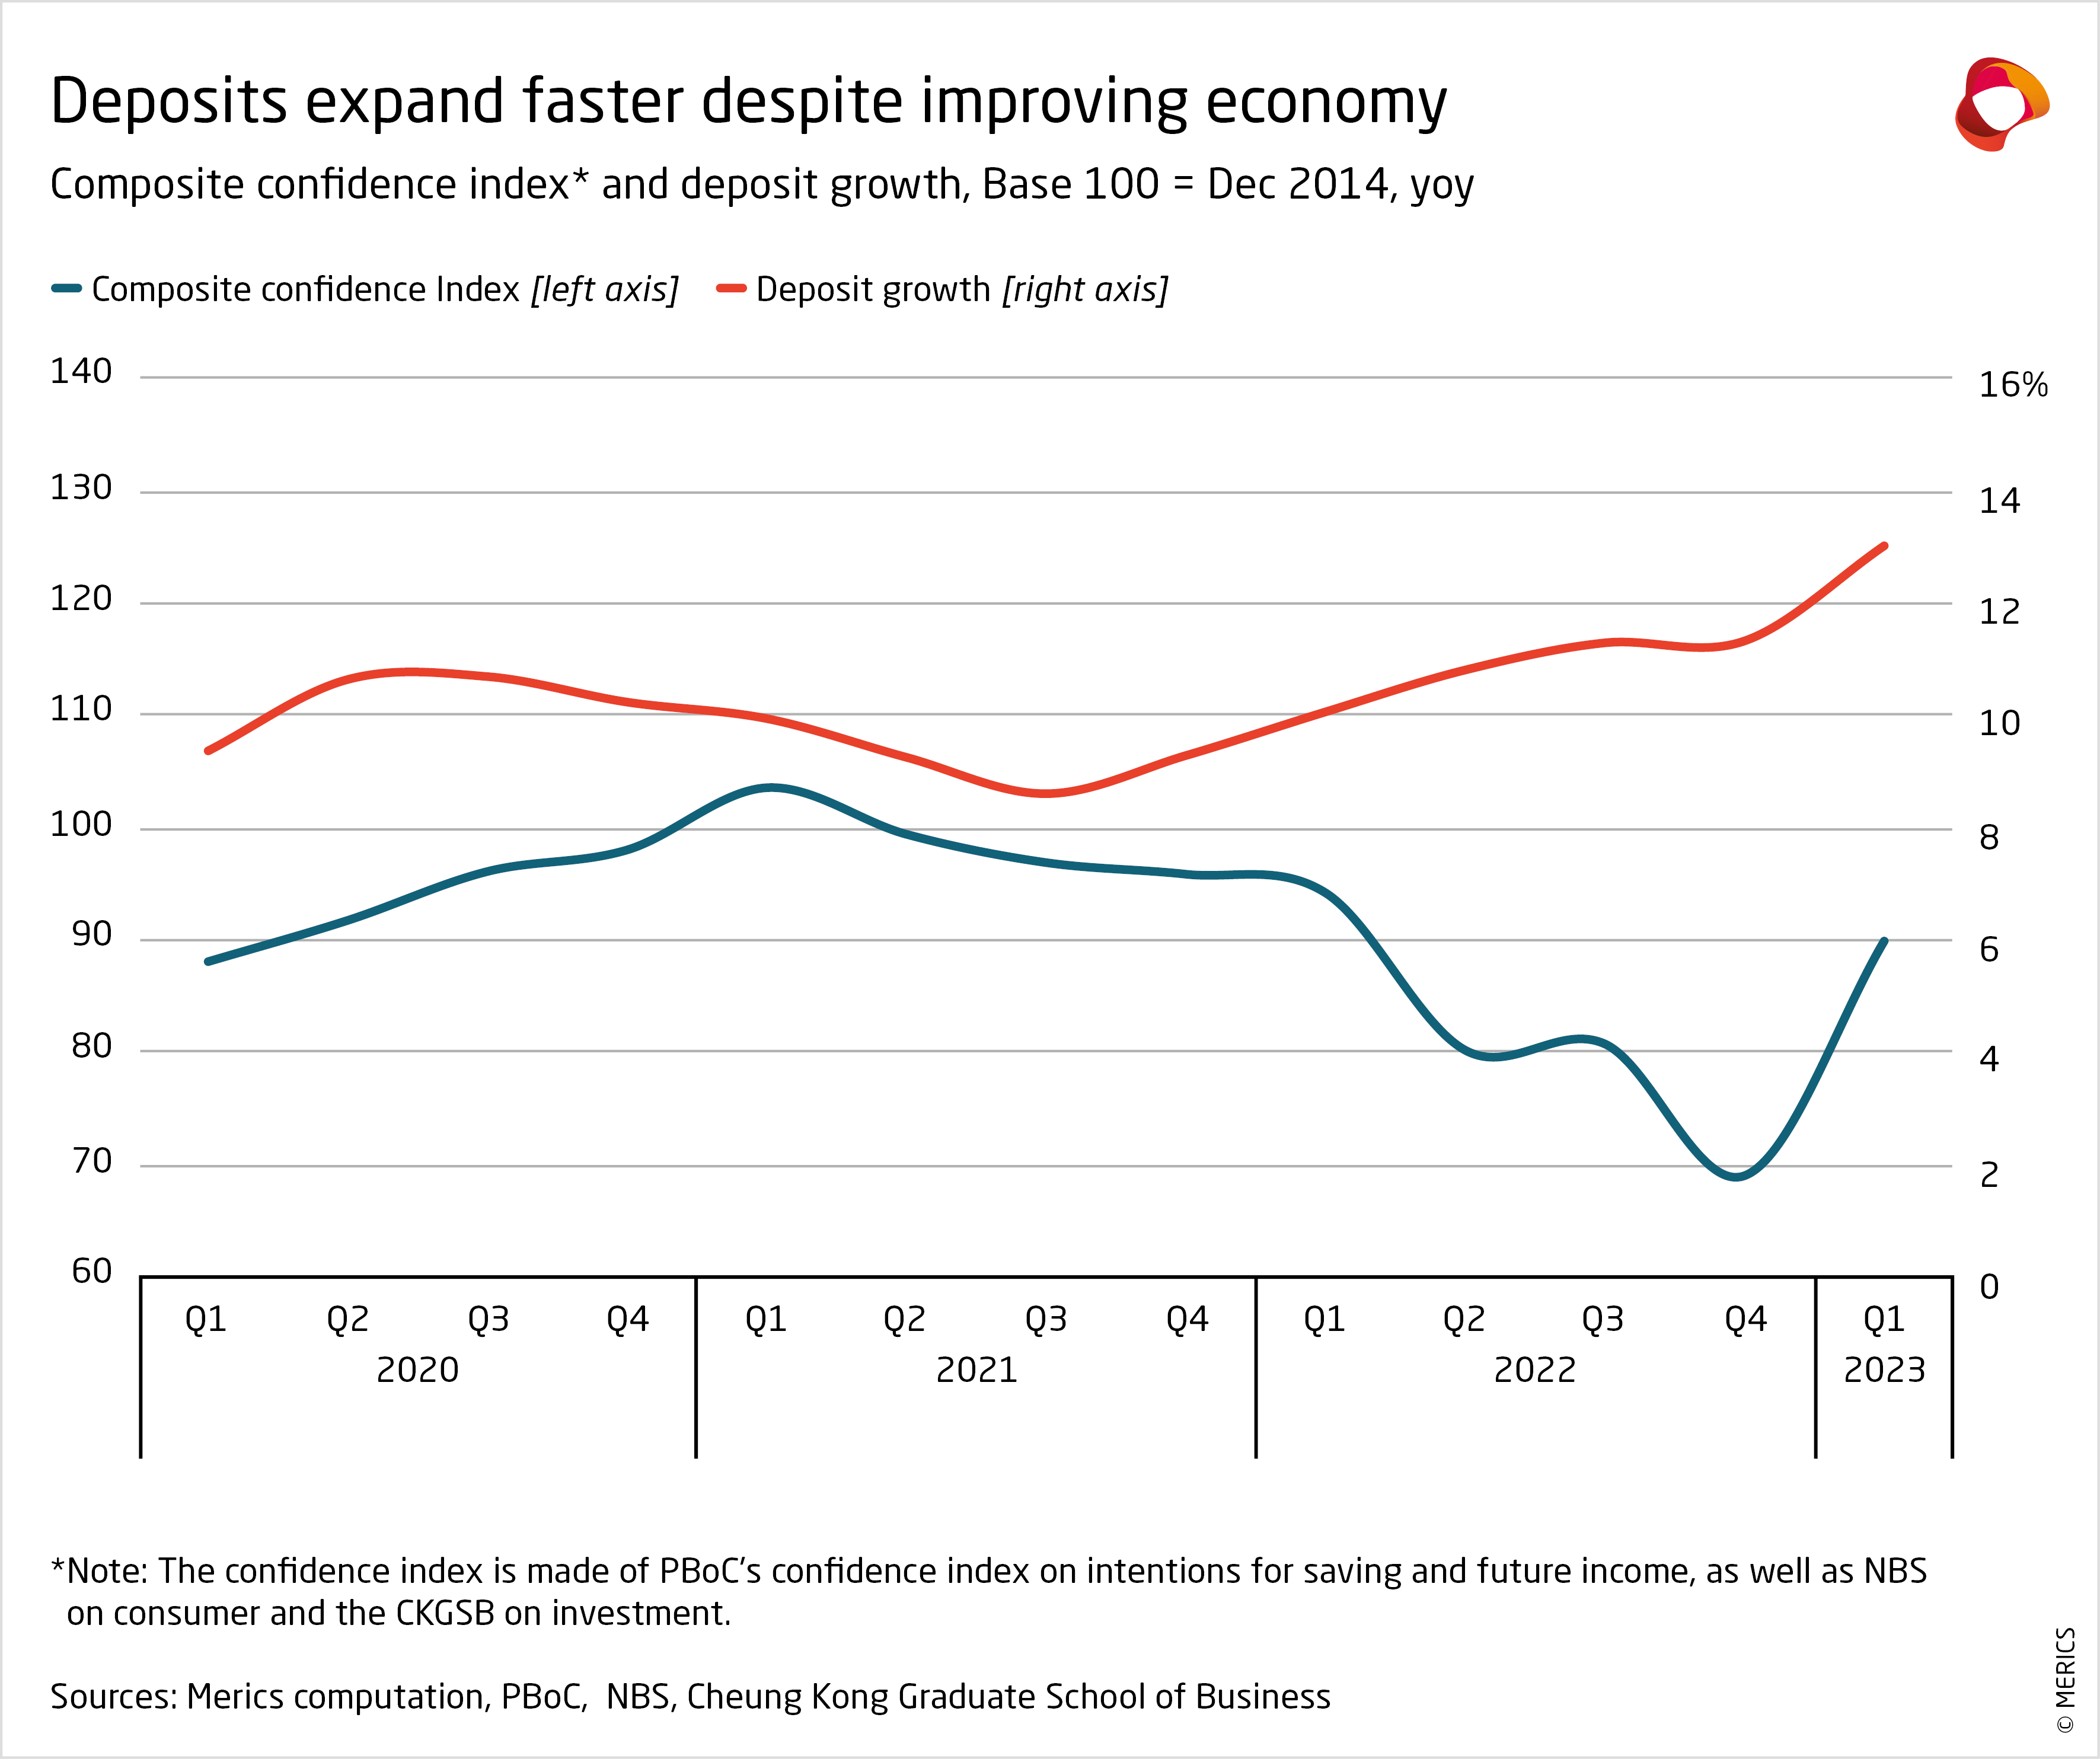
- Aggregate financing picked up over the quarter, expanding by 10 percent in March after dipping to just 9.4 percent in January. But it was outstripped by deposit growth, which expanded by 12.7 percent during the same period – a level last seen during financial market troubles in 2015/16 (see exhibit 1).
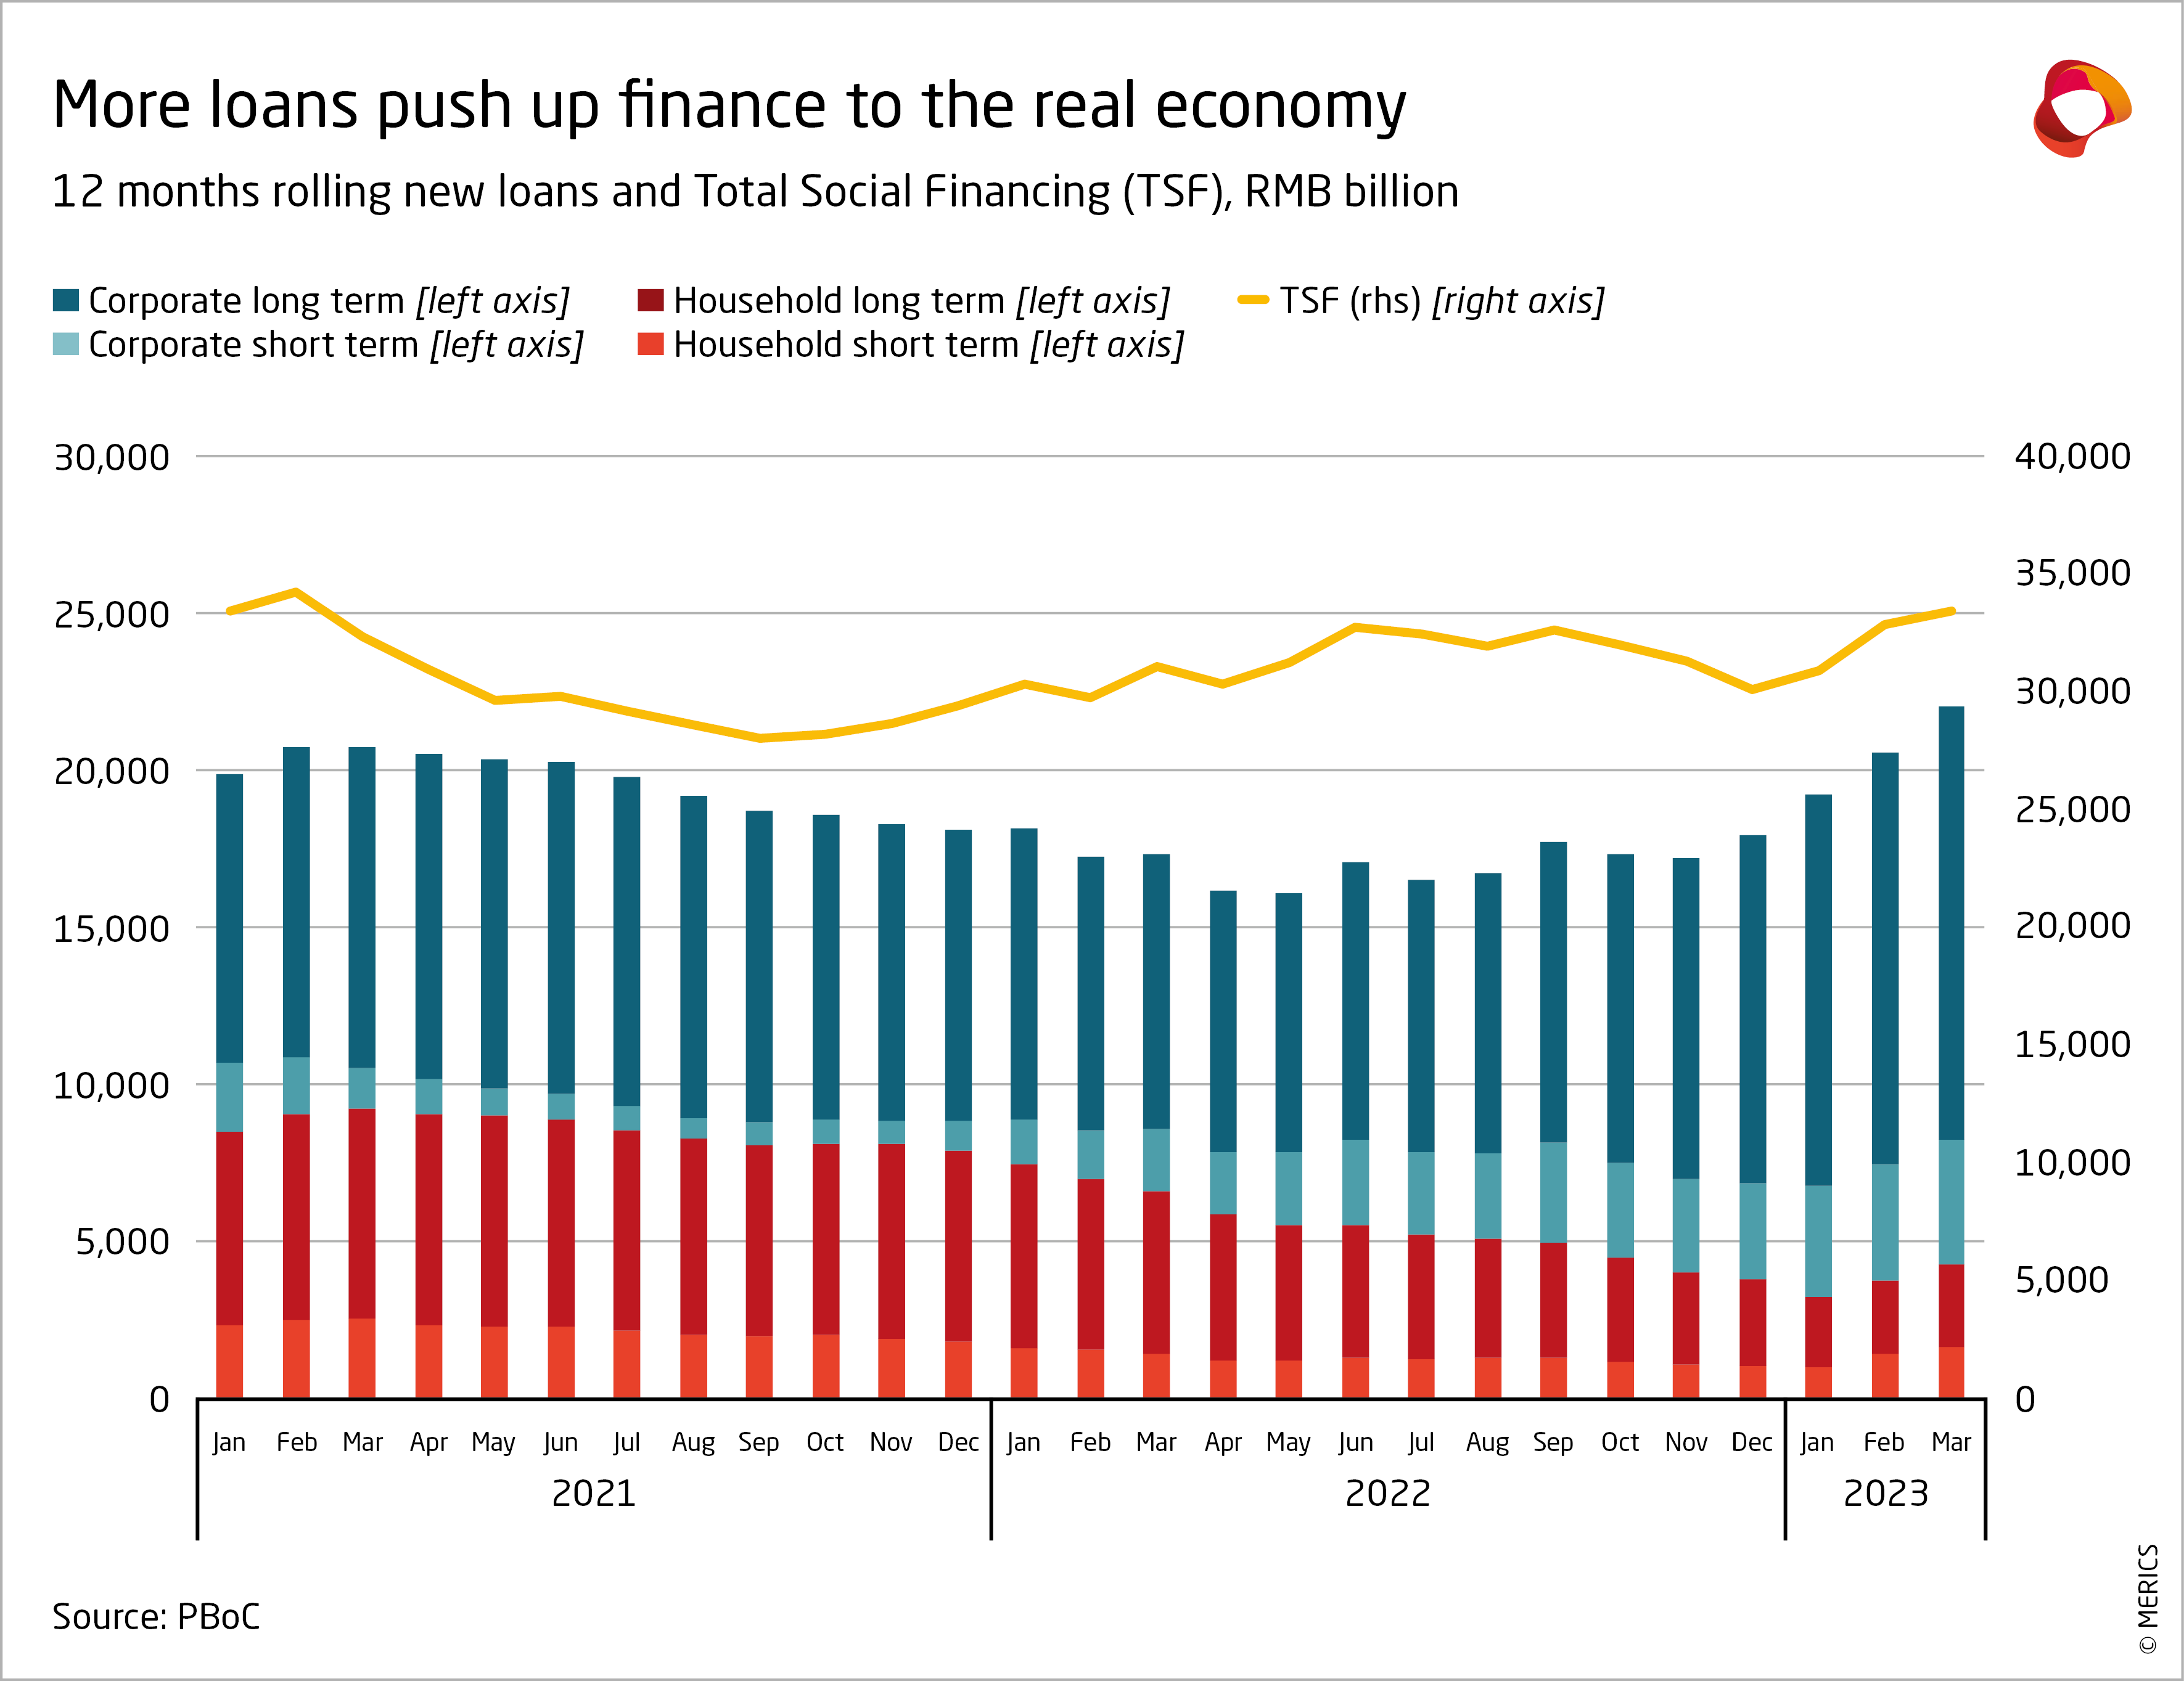
- Government bond issuance increased amid more infrastructure building demand. But growth in long-term credits from household was a key driver of growth in aggregate financing to the real economy (see exhibit 2). To a large extent, this reflects the recovery in China’s first tier cities.
- Q1 also saw a major overhaul of China’s financial regulators in favor of greater centralization. The newly formed National Financial Regulatory Administration (NFRA) replaces the China Banking and Insurance Regulatory Commission and will also take over some functions from both the PBOC and the China Securities Regulatory Commission.
What to watch: A stronger uptick in equity and bond issuance by private companies would indicate growing confidence in the economic recovery and would make the rebound more sustainable.
Investment: High levels of investment in manufacturing are gradually coming down
Exhibit 10
![]() Hover over/tap the charts to see more details.
Hover over/tap the charts to see more details.
Exhibit 11
- Investment remained flat in Q1. After inching up to 5.3 percent during the first two months, fixed asset investment (FAI) fell back to 5.1 by the end of March - the same level as at the end of 2022. Overall, investment has been far less volatile than other economic indicators throughout the pandemic and is expanding at a similar pace to 2019. However, there are large sectoral differences in investment activity.
- Manufacturing has been a key factor contributing to the resilience of investment, despite slowing steadily over the past 12 months. Manufacturing-related investment grew by 7 percent in Q1 year on year. Growth has averaged 11.3 percent over the last two years, which is well above the 6.3 average in the two years prior to the pandemic. The elevated levels suggest growth will gradually slow further, but high-tech related sectors will remain strong (see exhibit 1).
- The government sped up investment in infrastructure related projects at the start of 2023. Investment in new power generation plants – many of them coal-burning - accelerated from already high levels last year (see exhibit 2). As part of the stimulus package, railway investment rose to 17.6 percent in Q1 year on year. But overall infrastructure investment is will not be a key driver for the economic recovery.
- Private sector investment slowed to 0.6 percent in Q1, significantly below investment by state-owned enterprises which grew by 10 percent. Slow private sector growth was mainly due to the regulatory crackdown on the real estate and tech sectors. Private sector manufacturing investment rose by 10.3 percent, against a contraction of 4.4 percent in the service sector.
- The biggest drag remains the real estate slowdown, where investment has been contracting since April 2022. Despite a mild improvement in the first quarter, investment shrank by 5.8 percent at the end of Q1 year on year, compared to 10 percent at the end of 2022. The improvement was largely because residential building investment shrank by only 4.1 percent compared to a 9.5 percent fall in 2022. But commercial building investment slipped further: it contracted by 17.1 percent in Q1 compared to 14.4 percent in Q1 2022.
What to watch: Increases in real estate investment will need to pick up to balance out the slowdown in manufacturing.
Prices: Falling energy prices and weak demand ease inflation
Exhibit 12
![]() Hover over/tap the charts to see more details.
Hover over/tap the charts to see more details.
Exhibit 13
- The Consumer Price Index (CPI) rose by 2.1 percent in January, compared to the same month a year earlier, after zero-Covid restrictions were lifted in December 2022. However, CPI continued to fall during the rest of the quarter. In March, prices expanded by 0.7 percent, their lowest increase in 18 months. CPI seems likely to pick up in the coming months as consumption recovers. However, inflation is not likely to breach the government’s annual target of 3 percent.
- The mediocre recovery in consumer demand has not yet pushed up prices, so overall inflation has remained weak. Prices for services, consumer goods and household appliances did not pick up significantly over the first three months of this year (see exhibit 1).
- Falling energy prices (and to a lesser degree food prices) contributed to the extended decline in consumer prices. Prices for vehicle fuel contracted by 6.4 percent in March year on year, and utility costs, including energy, fell by 0.1 percent. However, the energy price drop largely reflected base effects; energy prices surged in early 2022 as Russia’s war against Ukraine disrupted oil and gas supply chains.
- The Producer Price Index (PPI)has contracted for six straight months. Prices fell by 2.5 percent in March year on year to their lowest point since June 2020. As with consumer prices, base effects played a role here, given that prices for key inputs surged early last year due to higher energy costs (see exhibit 2).
- Factory gate prices have stayed weak as there has not been significant uptick in demand or construction stimulus to push them higher. Automobile prices fell by 0.7 percent. Prices for construction related products such as ferrous metals (i.e., steel and iron), improved from their October low point (-21.1 percent), but nonetheless continued to contract by 11.2 percent in Q1.
- The drop in real estate prices has largely come to an end. In March, only 5 of the 70 cities tracked by the National Bureau of Statistics reported decreasing prices. This was a significant improvement as 55 cities had falling prices in December. The strength of the property sector’s recovery will be indicated by the extent of price rises, especially in lower tier cities.
What to watch: A stronger rebound in demand is needed for producer prices to break out of deflation.
Labor market: Employment pressure persists despite economic recovery
Exhibit 14
![]() Hover over/tap the charts to see more details.
Hover over/tap the charts to see more details.
Exhibit 15
- 2.97 million new urban jobs were created in Q1, up by 0.12 million on the same period last year. This was below pre-pandemic levels in 2019 when 3.24 million jobs were added. Demand gained momentum in March as 1.36 million new jobs were added, compared to 1.22 million last year. The government has increased its 2023 target for new urban jobs from to 12 million (vs 11 million in 2022).
- However, jobs growth is still relatively weak as the economy is only just reopening. Unemployment rose to 5.6 percent in February, up by 0.1 points from December, as Covid infections took a toll early in the year. Persistently high youth unemployment figures remain concerning: the rate for 16-24 year olds continued to climb over the quarter, reaching 19.6 percent in March (see exhibit 1).
- In 2023, yet another record cohort of university graduates (11.6 million) will need jobs. The government anticipates a total of 16.6 million entrants to the urban labor market – also a new record. However, China suffers from a growing skills mismatch as companies struggle to fill technical positions.
- Premier Li Qiang’s emphasis on an “employment first” strategy underlines the government’s concern about adequate job creation. It aims to provide training opportunities and the government will also create roughly 200,000 new civil service sector jobs 2023, which is 16 percent more than last year.
- As part of these efforts, Premier Li is also trying to restore the confidence of private enterprise after regulatory crackdowns in tech and real estate. Sustained recovery in the service sector will be vital for effective job creation. New regulations are being drawn up to enable more flexible employment in parts of the digital economy to stimulate service sector jobs growth.
- So far, four provinces have announced their annual minimum wage increases in 2023. Anhui province’s adjustment was particularly strong, up by 24.8 percent from the last increase in 2021 (see exhibit 2). But increases elsewhere were considerably lower, with Guizhou province raising wages by only 5.6 percent on the previous 2019 level.
What to watch: The government’s level of confidence in the labor market is revealed by how often it feels the need to issue new employment support measures.
Retail: Consumption recovery gains pace after a slow start in 2023
Exhibit 16
![]() Hover over/tap the charts to see more details.
Hover over/tap the charts to see more details.
Exhibit 17
- Consumption revived in March after a slow start to the year as Covid infections swept through the country following the sudden end of “zero-Covid” policies. Total retail spending grew by 5.8 percent in Q1 year on year, though growth was weak in January and February, including the Chinese New Year holiday. But both retail and restaurant spending significantly picked up in March (see exhibit 1). The strength of the recovery in consumption and services will be vital to China’s overall economic health in 2023.
- The urban depositor’s survey from the People’s Bank of China shows that consumer sentiment has not yet normalized post-lockdown. Preference for deposits – rather than investment or consumption – has come down only marginally, to 58 percent, from a record high of 61 percent in Q4 last year. Sentiment should continue to improve and return to near the ten-year average of between 40-45 percent in the coming quarters.
- From now on, retail growth is expected to improve further during 2023. Consumption was suppressed by some of the strictest lockdowns of the pandemic in Q2 2022, so the base effects in the reference period will ensure stronger retail spending growth.
- Sales of jewelry led the way, expanding by 37.4 percent in March, followed by fashion, which grew by 17.7 percent. Consumers were less willing to splash out on new electronics: sales of household appliances were down by 1.4 percent and sales of mobile devices grew by a mere 1.8 percent.
- In March, online sales of merchandise also reversed their continuous slowdown since October, expanding by 7.3 percent by the end of the quarter year on year. Growth jumped by 2 percentage points compared to year to date growth in December 2022, the biggest quarterly jump in two years.
- International air travel is booming after three years of near hiatus. Passenger traffic expanded by 998.6 percent in March on a year-on-year basis. There is much more room for growth in the coming months, as international travel is still at around 18 percent of pre-pandemic levels.
What to watch: The more quickly and strongly retail and services recover, the less stimulus measures the government will need to come up with.
Author(s)

Chief Economist

Analyst (Brussels office)

Former Analyst

Analyst
Author(s)
Chief Economist
Analyst (Brussels office)
Former Analyst
Analyst