Report
China's high and rising corporate debt
Examining drivers and risks
Main findings and conclusions
China’s corporate debt to GDP ratio, a measure of corporate leverage, is now among the very highest globally. It has risen nearly 65 percentage points within a decade, the fastest increase among the major economies.
A decade after the 2008 crisis, the total debt of the non-financial sector (government, corporate and household debt) worldwide has surged to a new high of nearly 242 percent as a share of GDP in 2017. In China, this ratio has almost doubled to the same level, making the country the most indebted emerging economy.
In contrast to many standard narratives, our research identified four driving forces behind China’s corporate debt dynamics. Taken together, they suggest that declining investment efficiency may have been one contributing factor to the marked rise in Chinese corporate leverage during the decade following the 2008 global financial crisis:
- A lower share of corporate capital investment financed by internally generated funds of the sector contributes significantly and consistently to faster build-up of corporate debt, for both China and elsewhere. China’s share of internally funded capital expenditure (capex) is the lowest of all 41 economies in our data sample – possibly due to poor corporate earnings combined with aggressive capital investment.
- Lower levels of government debt tend to lift corporate leverage as measured by corporate debt to GDP ratio. China has a light government debt load and a heavy corporate debt burden, so its corporate leverage is high. This is partially due to Chinese local governments financing some of their hastily chosen and questionable investment projects in the wake of the 2008 global financial crisis with corporate debt rather than through conventional fiscal borrowing.
- The effects of these two driving factors behind corporate leverage (i.e. internally funded capital expenditure share and government debt) are equally persistent elsewhere but appear stronger in China’s case. This may be due to the bigger presence of so-called zombie state enterprises and government-designated investment projects. Neither bodes well for investment efficiency.
- Finally, China’s investment rate is the highest among all the economies we examine, and a higher investment rate is found to raise corporate leverage significantly. Possibly, declining efficiency requires more investment to achieve a given economic growth, in turn contributing to China’s high corporate leverage.
This China Monitor summarizes some key findings of our forthcoming academic paper “The Role of Internally Financed Capex in Rising Chinese Corporate Debts”.1 Our research was prompted by concerns about China’s high and rising corporate debt and questions over whether the domestic invest- ments funded were worthwhile. We will also shed light on the China’s latest deleveraging campaign and assess its sustainability.
We use a broad international dataset of 41 countries to examine the roles of two determinants of corporate leverage – the share of internally funded corporate capital expenditure (capex) and government debt level. Our findings challenge and filter out over-reliance on heavily China-centric explanations that automatically emphasize special “Chinese characteristics” of the country’s financial market and government policy.
1. China’s high and rising corporate debt is unusually large
In this China Monitor, we aim to address two broad questions: why after the 2008 global financial crisis, China’s corporate debt reached such heights and whether these debts, corporate or otherwise, have funded sensible investment. In particular, we have identified the significant effects of the share of internally funded capex, government debt load and investment rate on corporate leverage.
These drivers behind corporate leverage are not China-specific and persist elsewhere, but their effects are stronger for China. Collectively, they point to declining investment efficiency as one possible culprit behind China’s high and rising corporate leverage during the decade following the 2008 global financial crisis.
A decade after the 2008 crisis, the total debt of the non-financial sector (consisting of government, corporate and household debt) worldwide has surged to a new high of nearly 242 percent as a share of GDP in 2017, a marked rise of 30 percentage points (see exhibit 1). Meanwhile, China’s almost doubled to the same height of 242 percent of GDP, making it the most indebted emerging economy.
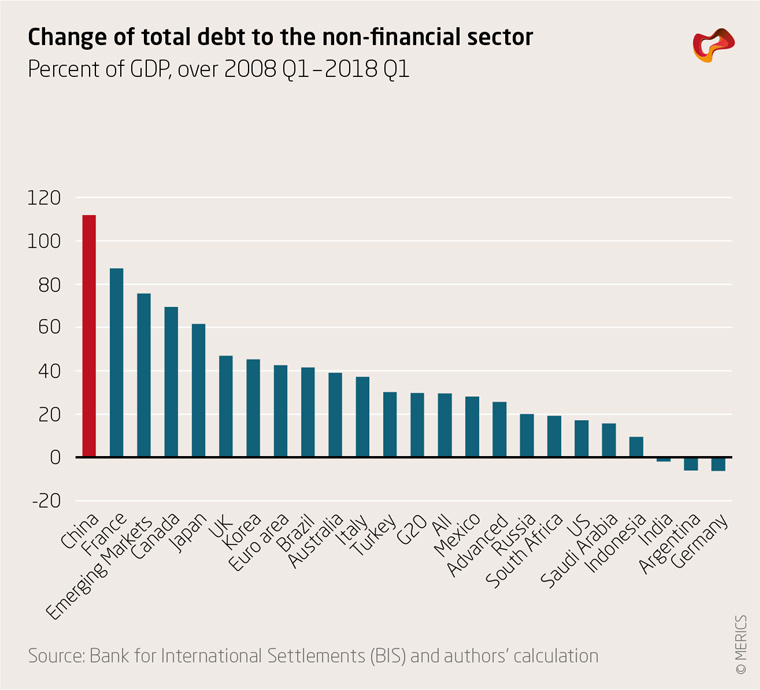
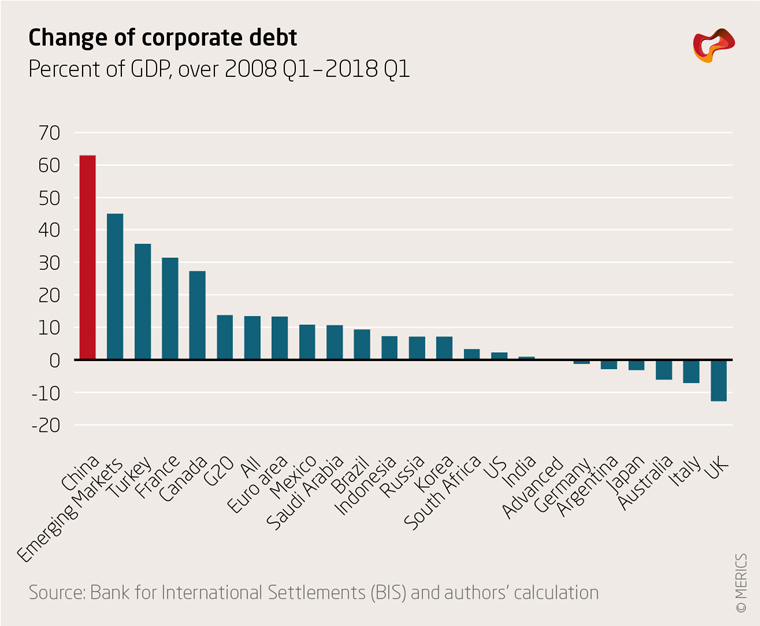
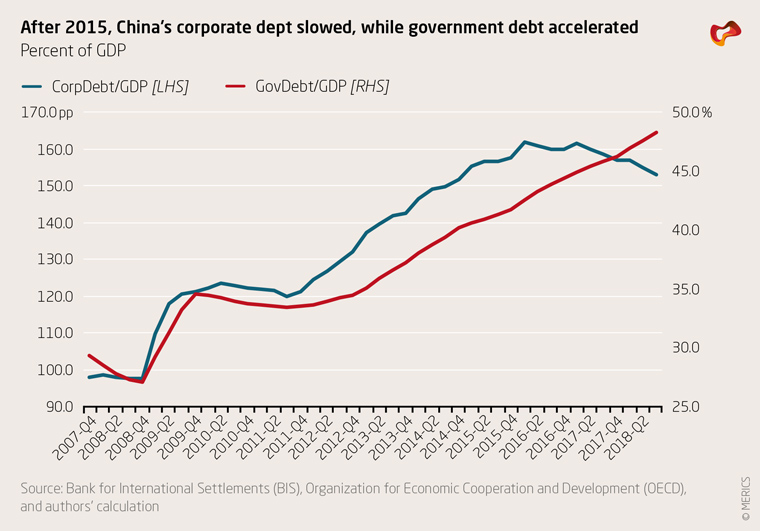
A major force driving rising overall indebtedness, for the world and for China in particular, has been the steep increase in corporate debt. China’s corporate debt to GDP ratio, a measure of corporate leverage, is now among the very highest globally. It has risen nearly 65 percentage points within a decade, the fastest increase among the major economies (see exhibit 2).
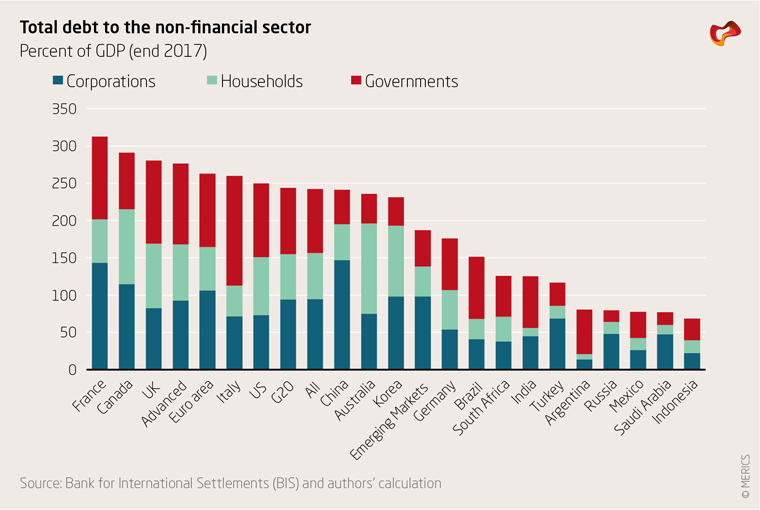
Finally, China’s interesting debt mix profile stands out. Relative to its international peers, China’s corporate debt burden is unusually large, while its government debt load appears modest (see exhibit 3). One has to wonder why the Chinese government has been such a prudent borrower, while its corporations seem excessive or even somewhat reckless in piling up debt.
How should we interpret these facts for both China and globally? Before examining some differing explanations, it is useful to remind ourselves that rising debt carries both risks and opportunities.
Borrowing and credit are two sides of the same coin. Credit can help expand productive capacity, smooth personal consumption spending over time, and bring forward asset purchases. If the realized returns on debt-funded investments turn out to be good, debt will be paid off, and both borrowers and lenders stand to benefit.
Fifty years ago, the Norwegian government made a brave decision to borrow and finance its investment into the huge North Sea petroleum project, at the prevailing oil price of some US$2 per barrel in the early 1970s. With hindsight, this risky, debt-financed investment has paid off fantastically – just witness the staggering US$1 trillion Government Pension Fund of Norway, also nicknamed the “Oil Fund”, built from investing petroleum revenues.
The scale of the North Sea project and the long timeframe of the rewards (that now fund Norway’s welfare system) are comparable in ambition and potential payoffs to China’s drive to modernize its national infrastructure.
Of course, investments can also go wrong if realized returns disappoint expectations. Outcomes can then include forced asset sales and painful austerity measures to generate cash to service the debt. Banks too may have to write off bad loans, and even downsize their business. The whole economy can then suffer a growth slowdown and financial chaos when struck by large-scale debt defaults.
China’s high, and rising, corporate debt presents grounds for concern. IMF staff economists warned in a 2018 working paper that China’s huge credit boom is on a dangerous trajectory, unsustainable, and presents increasing risks of a disruptive adjustment and steep growth slowdown over the longer term.2
1.1. Most narratives to explain high levels of corporate leverage are useful but flawed
Many narratives have been proposed to explain why Chinese corporate leverage is high. One explanation, put forward by the former Chinese central bank Governor Zhou Xiaochuan (2002 – 2018), is the exceptionally high domestic saving rate.3 The idea is that a high level of savings means there is an abundance of what economists call “loanable funds”, which one way or another need to be lent to companies. One problem of this narrative is that high savings also means strong cash flows and hence less need to borrow. In theory, therefore, high savings can lead to higher or lower corporate debt. Another problem is that China’s savings rate had already declined from a peak of 50 percent of GDP in 2006 to around 45 percent by 2016, precisely when Chinese corporate leverage climbed rapidly.
Another narrative centers on zombie state firms, companies that need bailout in order to operate. According to this story, many Chinese zombie state companies could not service their debt but have been propped up by state bank loans. Hence bad corporate debts borrowed and non-performing bank loans lent both keep on piling up, leading to high and rising corporate leverage. However, the importance of state banks and state enterprises within China’s overall trended lower over the period 2000 to 2016, when its corporate leverage surged. By contrast, there was notable Chinese corporate deleveraging in the decade before the 2008 crisis, at a time when state companies held a much bigger slice of the economy.4
Moreover, it is important to remember that some of China’s top private property developers are also among the biggest Chinese corporate bond issuers nowadays. Thus, the Chinese private sector was also a major borrower over this period as well, and the zombie story can only explain so much.
There are many other stories around to explain China’s high corporate leverage. They typically share some common weaknesses.
- First, these stories are often China-centric, assuming that the high Chinese corporate leverage is a result of some supposedly unique or special “Chinese characteristics”.
- Second, most of these narratives simply assume that financial considerations do not matter at all in Chinese corporate borrowing decisions.
- Third, these theories typically do not subject themselves to “horse-race tests”, whereby the influences of different factors on corporate leverage are checked using the same criteria to ascertain how relevant they are.
As a consequence, these explanations may miss, or at least under-appreciate, some of the leading drivers behind china’s corporate debt dynamics.
1.2. Two underappreciated factors stand behind corporate leverage
Our approach differs from most other explanations. We highlight two often-ignored determinants or explanatory variables of corporate borrowing, to factor in both financial conditions and government policy.
One is the “internally funded capex share”, which captures the effect of financial conditions when taking on or retiring corporate debt. The other is the level of government debt, which partially captures the influence of politics and policy. For both these two factors, we do allow for some special “Chinese characteristics” effects but reject the notion that only Chinese corporations are inherently debt hungry, while non-Chinese firms are naturally thrifty.
Let’s first start with financial considerations and incentives facing firms. We argue that corporations, Chinese or otherwise, take on new debt or pay off existing debt in response to the conditions they face, such as interest rate, earnings, cash flows and capex needs. At least, this possibility should not be simply swept under the carpet.
What might these financial considerations be when firms decide to raise or retire debt? One obvious candidate, as suggested by well-known corporate finance theories, is the “ratio of internally generated funds over capex” or equivalently “the share of internally funded (financed) capex”. Internally generated funds mostly consist of retained earnings and depreciation. Intuitively, a higher share of internally funded capex suggests stronger cash flows relative to capex needs and hence a less need for new borrowing, and vice versa. This is one central hypothesis to be tested in our paper: the ratio of internally generated funds over capital expenditure negatively affects corporate leverage.
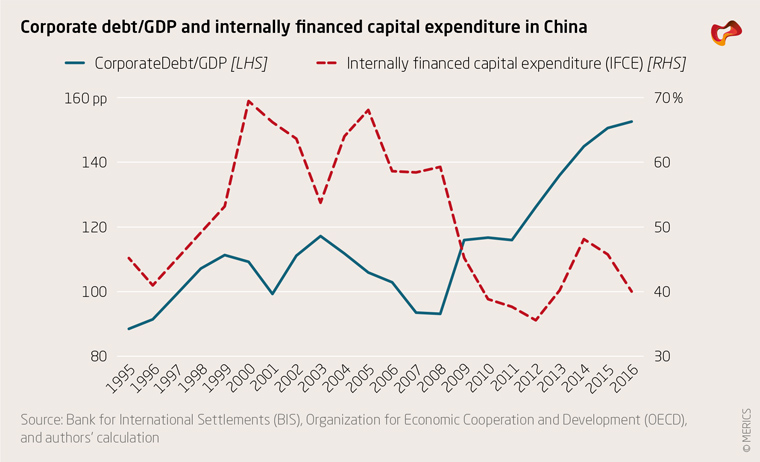
This negative effect can be more pronounced in China’s case. As corporate earnings slow just when government-driven “corporate” investment accelerates, the ratio of internally generated funds to capex of course declines more, necessitating even greater “corporate” borrowing to fund capex (see exhibit 4). Also, as earnings weaken, even more zombie state firms may struggle and need to be bailed by additional loans from state banks. Or both.
Next, we turn to our second proposed determinant of corporate borrowing: government debt. As noted earlier, China is burdened with a heavy corporate debt load but has manageable government debt obligations (see exhibit 3). This interesting profile prompts the question of why the Chinese government is prudent while Chinese corporations are aggressive in leveraging up. To explore this question, it is useful to consider two sets of forces, “shadow borrowing” and “shadow banking”, that may have influenced the dynamics between China’s government and corporate debts.
1.3. Shadow borrowing explains China’s mix of high corporate leverage and modest government debt
“Shadow borrowing” refers to debt obligations issued by corporate entities linked to Chinese local governments. These -linked, -sponsored or -owned legal corporate entities are collectively called “local government financing or funding vehicles” (LGFVs). Before 2015, the Chinese local governments faced the strict legal prohibition of borrowing, as specified by the 1994 Budget Law, but also had powerful incentives to circumvent it via these LGFVs, since local government officials got promoted faster by pursuing higher local GDP growth. In a knee-jerk reaction to the 2008 global financial crisis,5the Chinese government in 2009 launched a huge stimulus program funded in part by “shadow borrowing”.6Effectively, the Chinese government at that time tacitly turned a blind eye to “shadow borrowing” by the local governments.
As a result, much of such “shadow borrowing” undertaken by local governments was often recorded as corporate debt. This in part helps explain China’s interesting mix of exceptionally high corporate leverage and a relatively modest government debt load.
It raises a big question of how much of these LGFV debts should be regarded as “corporate” or “government” debt (see exhibit 3). Furthermore, their actual demarcation can evolve over time, in light of the recent sizable swaps of some LGFV debts into official local government bonds starting in 2015.
1.4. Shadow banking inflates corporate debt
At the same time, “shadow banking” also expanded. China’s financial system experienced broad-based deregulation over the decade ending 2015, becoming less tightly regulated.7Many LGFVs that had initially borrowed from banks during 2009 soon came under rollover and refinancing pressure. To accommodate the mess, “shadow banking” expanded considerably. Shadow banking also catered to the rise of real estate companies and less-privileged private firms as holders of corporate debt. The outcome was that China’s corporate debt might have been inflated, while official government debt data could be understated.
One implication is that smaller government borrowing relates to bigger corporate borrowing, and vice versa. This negative relationship is not China-specific but also applies to other economies. Japan is a case in point. As the Japanese corporate sector deleveraged in the 1990s and 2000s, its government stepped in to undertake fiscal borrowing, in an attempt to counter the adverse impact on the Japanese economy. Hence one observes a negative relation between ballooning government debt and shrinking corporate debt in Japan’s “lost decades”. Again, in some European economies, local banking crises hurt corporate lending, prompting fresh bank capital injections funded by larger government deficits. There too, government and corporate borrowings negatively relate to each other.
In any case, such a negative relation between government and corporate debts should not be taken as a unique “Chinese characteristic”. However, we allow for the possibility that this negative effect may be stronger in China’s case than elsewhere, as Chinese local governments may have strong incentives to tap the LGFVs.
In summary, our expectation is that the share of internally funded capex share and the government debt level will both negatively affect corporate leverage, probably more so in China’s case. These expected negative effects are two central hypotheses we test in our statistical regressions, using a broad international panel dataset that covers 41 economies. We take into consideration many other possible factors, such as the impacts of the global financial crisis, income level, growth, investment rates and saving rates. The appendix offers more details about the methodological and data issues.
2. Four core findings point to questionable investment efficiency in China
Of our many empirical findings, we wish to highlight four core findings and their broad implications.
First, the share of internally financed capital expenditure significantly and negatively affects corporate leverage: a lower ratio of internally generated funds to corporate capex consistently contributes to higher corporate leverage, as weaker internally generated cash flows pressure firms to fund their new capex with more new borrowing, and vice versa (see exhibit 5). This conclusion is robust for both China and elsewhere, even after controlling for a long list of other factors. This thus is not a simple story of “Chinese characteristics.”
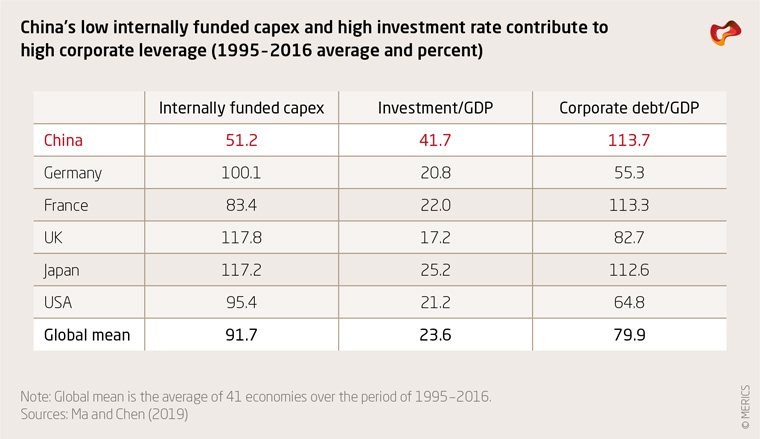
However, China’s internally financed capex share of 51 percent is the lowest among the 41 economies covered by our data sample and only about half of the global mean (92 percent) or that of Germany (100 percent).

This is a possible signal of the combination of China’s relatively low returns and aggressive capex spending (see exhibit 8), though there may be other causes.
Second, lower government debt tends to relate to higher corporate leverage. Some of the surge in reported Chinese corporate debt after the 2008 global financial crisis likely reflects heavy “shadow borrowing” through LGFVs. However, this negative effect of government debt on corporate leverage holds even after we remove China from the data sample. It is, again, not China specific (see exhibit 6).

In China’s case, some “shadow borrowing” was used to fund government-designated and hastily chosen investment projects as an emergency response to the 2008 global financial crisis. There are legitimate concerns about the efficiency of and expected returns on some of these projects.
Third, the above two conclusions hold simultaneously. This suggests that both determinants may have influenced corporate leverage at the same time. Even after excluding China from our international data sample, these negative effects still persist, suggesting that our narrative is not just another special “Chinese characteristics” story.
However, the effects of both determinants on corporate borrowing appear stronger in China’s case, indicating some relevance of the “Chinese characteristics” narratives. Relative to their international peers, Chinese companies borrow more in response to either weaker corporate earnings or possibly understated government borrowing.
There could be many possible causes behind the stronger Chinese responses, including government stimulus and the prevalence of zombie firms. Government investment projects funded by the LGFV debt were rushed through to stimulate China’s economy in the face of adverse shocks. Also, China has more zombie firms than the other economies covered; its corporate leverage therefore rises even faster when corporate earnings slow. Both possibilities do not bode well for investment efficiency.
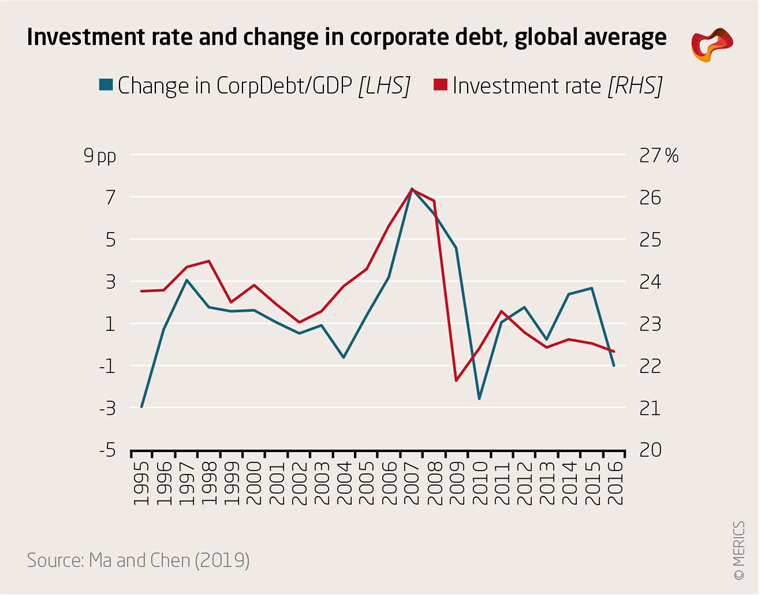
Finally, a higher investment rate strongly adds to corporate debt load, while a higher saving rate actually slows corporate leverage (see exhibit 7).Hence, a high saving rate neither explains nor justifies China’s high corporate leverage, casting doubt onthe China-centric story that China’shigh corporate leverage is mainly attributable to its high saving rate, while highlighting the prominent role of the investment rate.
One implication is that a decline in investment efficiency may contribute to a higher corporate debt/GDP ratio, since sustaining a given economic growth rate would require a higher investment rate. For instance, sustained high investment could lead to diminishing marginal returns, in turn depressing the internally funded capex share.
Of the 41 economies within our data sample, China has the highest investment rate (42 percent), almost twice as high as the global average of 24 percent and Germany’s 21 percent (see exhibit 8), thus likely contributing to higher Chinese corporate leverage.
All told, these findings suggest that the strong and prolonged surge in China’s corporate debt/GDP ratio over the past decade was at least partly the combined consequence of its high investment rate and low internally funded capex ratio, or simply declining investment efficiency.
No wonder China’s corporate debt relative to GDP averaged 113 percent during 1995 – 2016, way above the global mean of 80 percent and more than twice as high as Germany’s 55 percent over the same period (see exhibit 8).
3. Conclusion: Short-term risks of deleveraging and long-term implications
3.1. The short term: the latest deleveraging campaign has mixed blessings
In the short term, what can we say about China’s latest “deleveraging” campaign? Although our data sample is only up to 2016, and the campaign did not start until around 2015, we can still learn a lot from our core empirical findings to shed light on this campaign. In particular, they suggest this campaign could be a mixed blessing in terms of achieving sustainable deleveraging.
The campaign’s major objectives included curbing “shadow borrowing” and “shadow banking”. To do so, it offered local governments some legal access to the domestic bond market, while tightening regulations over certain heavily indebted industries. One campaign device has been to swap some LGFV corporate debts into local government bonds. This should facilitate headline corporate deleveraging, but keep government obligations elevated (see exhibit 9).
The campaign thus looks more like a “debt swap” than deleveraging, though less LGFV borrowing may eventually trim government-designated investment, in turn improving efficiency and facilitating overall deleveraging. China’s overall debt of the non-financial sector appears to have broadly stabilized since 2017, after a decade of rapid ascent.
However, we suspect that private firms are likely to bear more of the adjustment pains associated with the latest “deleveraging” campaign. Private companies in China tend to be more efficient but also more dependent on shadow banking, because of their limited and disadvantaged access to the official financial system. The campaign could therefore hurt private firms and corporate earnings harder than those of state-backed zombies.
Our findings show this could depress the ratio of internally generated funds over capex, in turn eventually pushing up corporate leverage and casting doubt on the longer-term sustainability of the campaign. But a fuller picture of the campaign’s impact on corporate earnings will have to wait for another two years.
In any case, for this “deleveraging” campaign to be more sustainable, it needs to be complemented with other restructuring and liberalization programs, such as opening up market competition, speedier exits and entries to weed out zombie firms, trimming the overall weight of the state companies in the economy, and greater efforts to improve the access of smaller and mostly private Chinese firms to credit.
3.2. The longer term: efficiency of investment warrants some caution
Beyond the latest “deleveraging” campaign, what might be the longer-term implications of our core findings for China’s economy?
While it is still too early to tell, as infrastructure projects tend to have long investment cycles, the main message derived from our core empirical evidence is that the expected efficiency of China’s debt-financed investment over the decade following the 2008 global financial crisis at least warrants some caution.
In the end, it brings us back to the legendary Norwegian “Oil Fund”, begging answers to a host of questions that we have not directly addressed yet. Will China’s gigantic infrastructure and other investment programs, whether funded by “corporate” or “government” debt, eventually pay off in terms of higher productivity and sustained economic growth?
More specifically, have the bulk of these investments been sunk into reasonably productive pockets of the Chinese economy? And how well will such sunk-in costs be maintained, managed and utilized in the coming decades? Further, can “China Inc.”, with a more debt-burdened balance sheet, remain resilient against market and economic shocks? Finally, to help put the matter in perspective, while Chinese “corporate” debts must surely have funded some questionable investment projects, would they as a whole fare better or worse than those government debts issued principally to finance pension deficits and current public services in such economies as Japan, some European economies and the US?
Appendix: Methodology and data
Our forthcoming paper examines the roles of the two proposed determinants in corporate leverage, using a broad international panel data. In statistics jargons, we aim to test the two central hypotheses that government debt and the share of internally funded capex have negative effects on corporate leverage. We test these two factors together and let the data inform us whether both or which of the two determinants matter.
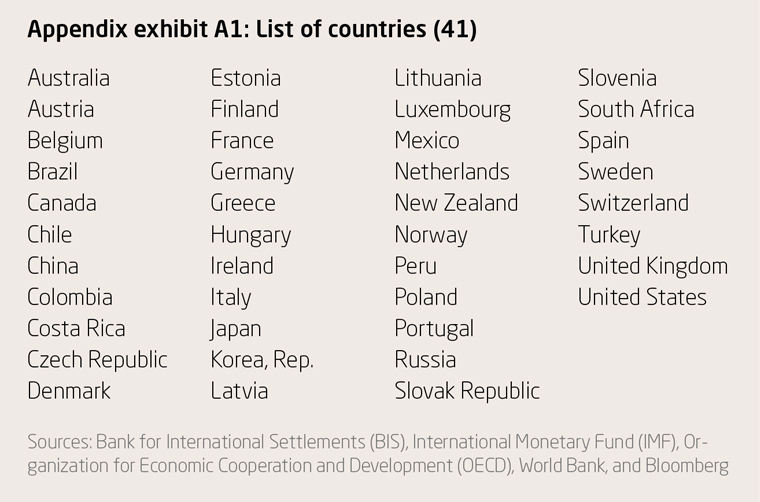
Table A1 details the full country list and data sources. Notice again that China is but one of the 41 economies included in our data sample, allowing us to avoid the possible biases inherent the China-centric narratives about corporate leverage.
However, we do allow for potential China-specific effects on corporate leverage, via two complementary approaches. First, we exclude China from the international data sample in some cases to see if the two central hypotheses still hold, in order to ensure that they are not simply a story of “Chinese characteristics”. Second, we try to tease out the marginal China effects of both determinants, effectively quantifying the differences between the average global effects and China-specific effects of these two key explanatory variables. That is to say, we give due respect to the “Chinacentric” stories.
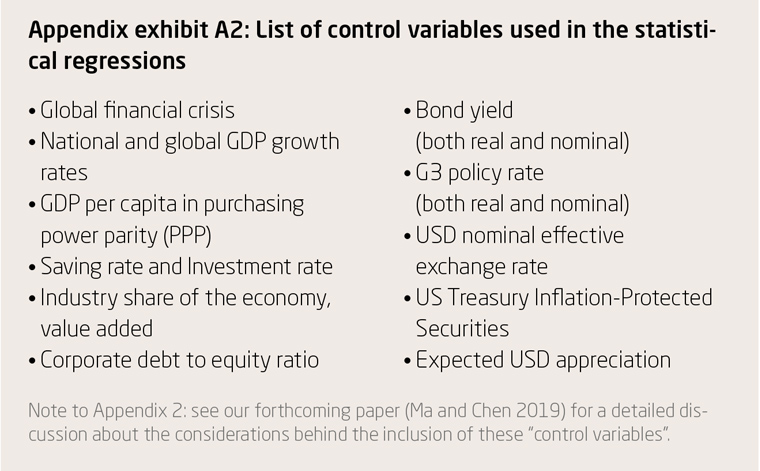
In our statistical analysis, we also take extra steps to minimize the possible interferences from other factors. First, we take care of the possible effects of the 2008 global financial crisis (GFC), since our dataset covers both the crisis and non-crisis years. As the global financial crisis potentially influenced corporate borrowing decisions, either directly or indirectly via its possible impacts on government debt and the ratio of corporate earnings over capex, or both, we “control” for these GFC effects in the statistical regressions.
Moreover, there are many other economic and financial factors that can also affect corporate leverage, in addition to our two proposed determinants. These can include national and global GDP growth, investment rates, saving rate and interest rates, etc. Their potential effects need to be accounted for or “controlled”. For instance, a higher income level could relate to a deeper financial market and greater debt servicing capacity, thus potentially boosting corporate leverage. Altogether, we have taken care of a long list of such economic and financial “control variables”.
Finally, we take care of other technical issues such as trend property (stationarity), possible two-way interactions among variables, alternative statistical approaches, etc.
- Endnotes
-
1 | Ma, Guonan; Chen, Jinzhao. The Role of Internally Financed Capex in Rising Chinese Corporate Debts“. Journal of Comparative Economic Studies, Springer Nature, 2019: https://rdcu.be/bG8tj
2 | Chen, Sally and Kang, Joong Shik (2018): “Credit Booms – Is China Different?” IMF Working Paper No. 18/2, International Monetary Fund: Washington DC: https://www.imf.org/en/ Publications/WP/Issues/2018/01/05/Credit-Booms-Is-China-Different-45537 (last accessed: July 31, 2019)
3 | Zhou, X. (2016): “PBC Governor speech at the 2016 China High-Level Development Forum”. (中国人民银行行长周小川在2016中国发展高层论坛上的讲话及答问) http://www.pbc. gov.cn/goutongjiaoliu/113456/113469/3035010/index.html. Accessed 2 January 2019
4 | Ma, Guonan and Laurenceson, James. (2017): “China’s debt challenge: stylized facts, drivers and policy implications”. The Singapore Economic Review 61(1): pp 1-23.
5 | Ma, Guonan, McCauley, Robert and Lam, L. (2013): “The roles of saving, investment and the renminbi in rebalancing the Chinese economy”, Review of International Economics, 21(1): pp 72–84.
6 | Zhang, S and Barnett, S. 2014: Fiscal Vulnerabilities and Risks from Local Government Finance in China. IMF Working Paper WP/14/4, International Monetary Fund: Washington DC.
7 | Ballantyne, A, Hambur, J, Roberts, I and Wright, M. (2014): “Financial Reform in Australia and China”. Reserve Bank of Australia Research Discussion Paper RDP 2014-10.
The publication series “China Monitor Perspectives” provides MERICS fellows with the opportunity to present their current research. The views represented in the paper are the author’s alone, and do not represent the views of any institution with which he is affiliated.
Author(s)

Former Visiting Academic Fellow
Author(s)
Former Visiting Academic Fellow